I Read 5,000 books in 30 minutes. But Why?
Why Read So Much???
In our ongoing journey to improve learning and development at NAB, we've embarked on a project that might seem a bit unusual at first glance—we read 5,000 books in just 30 minutes. But why would we do that? The answer lies in our commitment to ensuring that the materials we provide are not only informative but also appropriately challenging for our learners. This project is part of a larger initiative we call the "Heuristic Benchmarker."
Why We Created a Heuristic Benchmarker
The Capability Architecture is still relatively new, it links to our Job Architecture and ultimately maps specific capabilities at different proficiencies, to the roles within our organseation. This architecture is designed to clearly outline what capabilities are required at what level of proficiency for each role. However, only about 30% of these capabilities have been properly validated so far, which means there's a significant opportunity for improvement.
To make matters more interesting, we also have access to Udemy's extensive course catalog through their GraphQL API. Our goal is to match the capabilities outlined in our architecture with relevant courses from Udemy, helping our employees build the skills they need to succeed. But before we can confidently match capabilities to courses, we need to understand the quality and complexity of the texts on both sides—this is where our heuristic benchmarker comes in.
What is a Heuristic Benchmarker?
In simple terms, a heuristic benchmarker is a tool that helps us evaluate the complexity and quality of blocks of text. By using advanced Natural Language Processing (NLP) techniques, we can assess how challenging a piece of text is and how well it aligns with the capabilities we've defined. This helps us ensure that our learning materials are neither too simple nor too complex for our intended audience.
How We Did It
Here's a breakdown of the steps we took to create and apply our heuristic benchmarker:
- Gathering the Books: We started by downloading 5,000 books from Project Gutenberg. This gave us a diverse dataset to work with, spanning a wide range of topics and complexity levels.
- Processing the Text: We broke down each book into smaller sections—specifically paragraphs—so we could analyse the text in more detail. We also cleaned up the text by removing any unnecessary symbols or spaces.
- Measuring Complexity with TF-IDF: Using a method called TF-IDF (Term Frequency-Inverse Document Frequency), we calculated the importance of different words within each paragraph relative to the entire collection of texts. This gave us a score for each paragraph, indicating its complexity.
Why Evaluate These Blocks of Text?
The primary purpose of this work is to ensure that the inputs we use for NLP matching between our Capabilities and Udemy's courses are solid. By evaluating the complexity and lexical diversity of the texts, we can identify any gaps or areas where our capability descriptions or course offerings might need improvement. This is crucial for ensuring that our employees have access to learning materials that truly meet their needs and help them develop the required skills.
Evaluating the Complexity of 32 Million Sentences: TF-IDF Analysis of the Gutenberg Archive
To better understand the complexity of the texts within the Gutenberg archive, we conducted a TF-IDF analysis on a massive dataset containing 32 million sentences extracted from 5,000 books. This analysis allowed us to measure the importance of individual words within each sentence relative to the entire dataset, providing us with a nuanced view of text complexity.
Breaking Down Complexity Levels
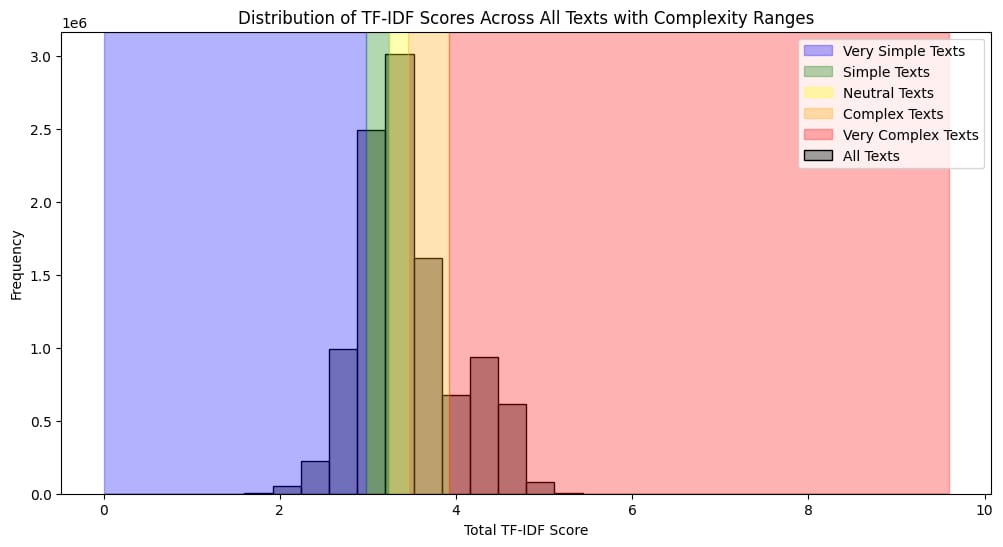
By calculating the TF-IDF scores for each sentence, we were able to categorise the texts into different levels of complexity. The key thresholds, determined by quintiles, were:
- Very Simple Texts: Sentences with a TF-IDF score below 2.98.
- Simple Texts: Sentences with a TF-IDF score between 2.98 and 3.24.
- Neutral Texts: Sentences with a TF-IDF score between 3.24 and 3.46.
- Complex Texts: Sentences with a TF-IDF score between 3.46 and 3.92.
- Very Complex Texts: Sentences with a TF-IDF score above 3.92.
These quintile-based thresholds allowed us to visualise the distribution of text complexity across the entire dataset. As seen in the distribution plot, the majority of sentences fell into the "Neutral" and "Simple" categories, with fewer texts reaching the extremes of "Very Simple" or "Very Complex."
Visualising the Results
We employed two key visualisations to better understand the distribution of text complexity:
- Histogram of TF-IDF Scores: This histogram shows the frequency of sentences at different complexity levels, clearly illustrating the spread across our quintile ranges. The color-coded sections represent the different categories, making it easy to see which complexity levels dominate the dataset.
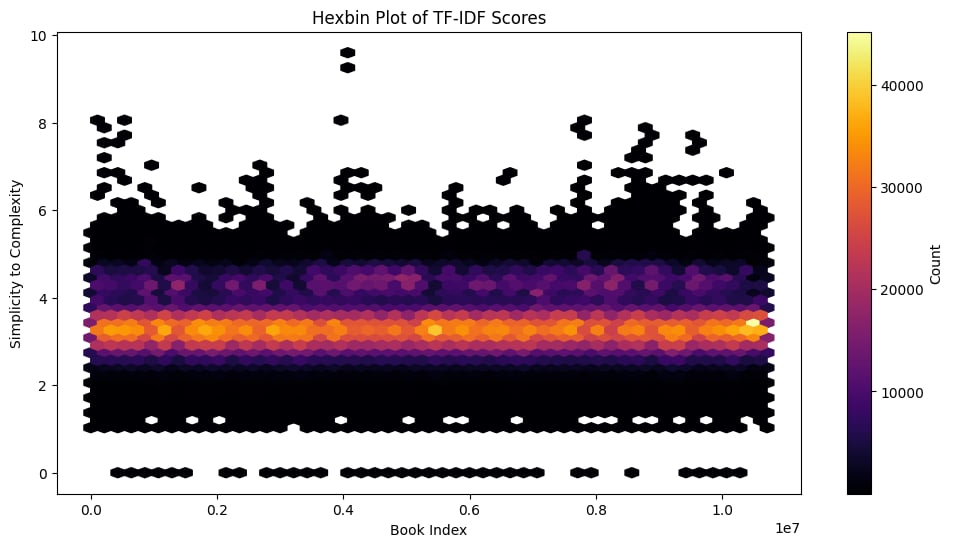
- Hexbin Plot: To explore the relationship between the book index and text complexity, we used a hexbin plot. This dense scatterplot highlights how simplicity and complexity are distributed across the entire corpus, with the majority of texts clustering around the mid-range of complexity.
These visualisations provide a clear overview of the complexity within our dataset, helping us identify patterns and areas that may require further attention.
Applying the Heuristic: Insights from the Capability Architecture
Having established our heuristic based on the quintiles, we now turn to applying this approach to our real-world data, starting with our Capability Architecture. This analysis focuses on various data points within the architecture, providing a detailed understanding of the complexity associated with different aspects of our capability framework.
Analysing the Data Points
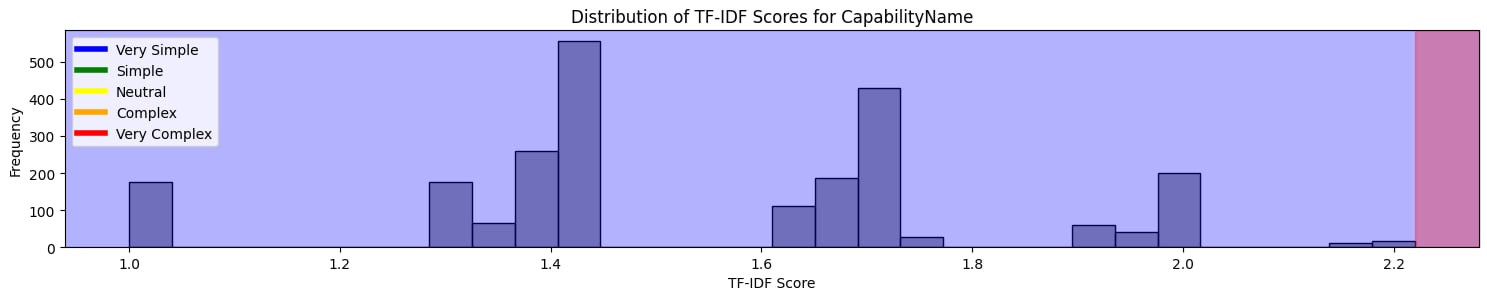
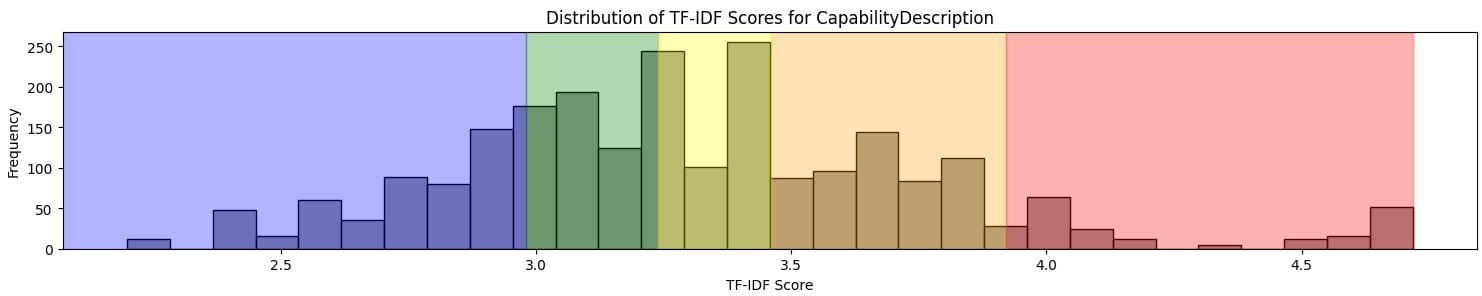
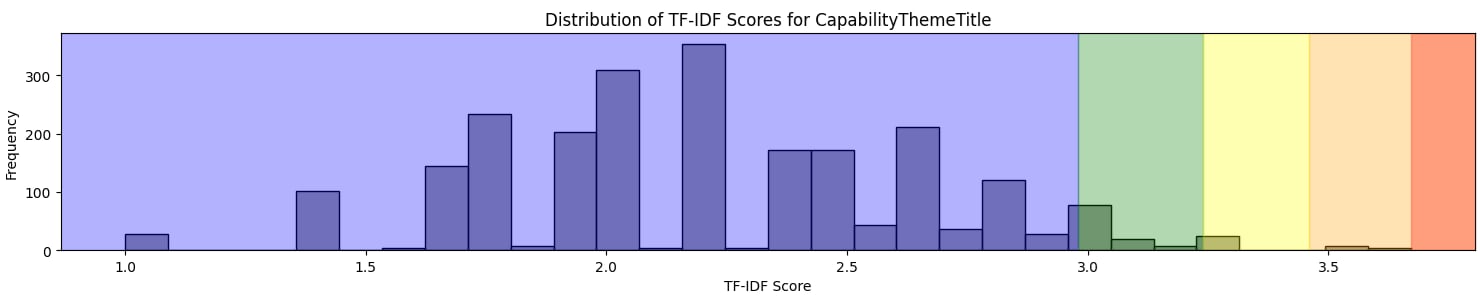
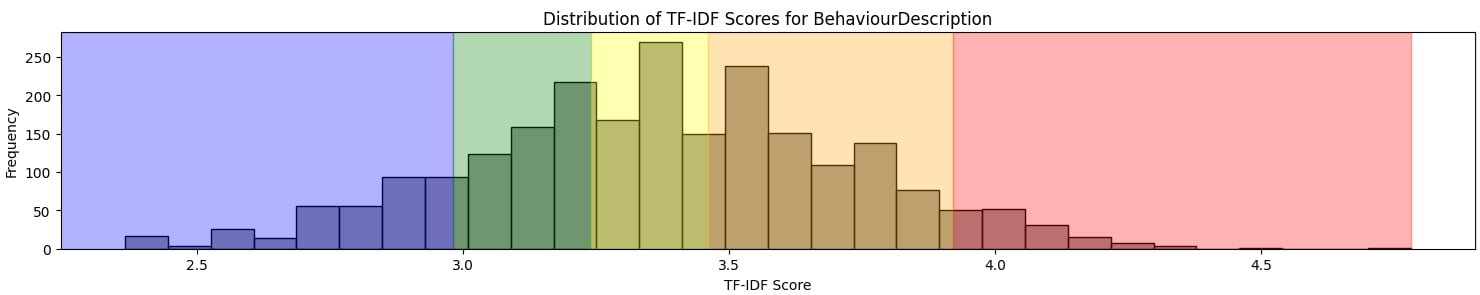
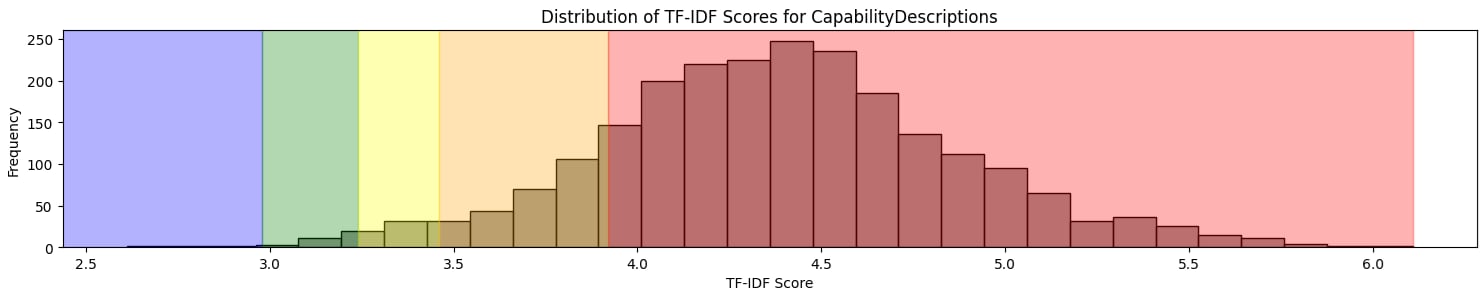
Below are the TF-IDF distributions for different components of the Capability Architecture, including Capability Name, Capability Description, Capability Theme Title, and Behaviour Description. These histograms provide a visual breakdown of the complexity associated with each component:
- Capability Name: The distribution indicates a focus on simplicity, with most names falling within the "Very Simple" and "Simple" categories. This is expected, as capability names are typically concise.
- Capability Description: The descriptions show a broader range of complexity, with a significant portion in the "Neutral" and "Complex" categories. This suggests that while some capabilities are straightforward, others require more detailed and nuanced explanations.
- Capability Theme Title: Similar to the Capability Name, the theme titles mostly fall into the simpler categories. This aligns with the purpose of theme titles, which are meant to encapsulate broad topics succinctly.
- Behaviour Description: Notably, the behaviour descriptions show the widest range of complexity, with a clear spread across all quintiles. This is particularly interesting as these descriptions articulate behaviours across different levels of seniority, necessitating both simplicity for junior roles and more complex, detailed descriptions for senior roles.
- All of it together: This is where it actually gets a bit interesting. Realistically, using any one individual piece of text from the Capability Architecture might not yield us enough insight to use in a Natural Language Processing model - it's simply not enough information, for a computer or a person. So if we join all those different pieces of text together, and call it 'Capability Description', we get the below. Now we're starting to see some complexity we can use to pair courses against.
The Behaviour Description data is particularly revealing. The wide distribution across complexity levels reflects the varying requirements for different roles within the organisation. Junior roles might require straightforward, actionable behaviours, whereas senior roles demand more nuanced, strategic behaviours, resulting in more complex descriptions.
By analysing these distributions, we gain valuable insights into how our capabilities are structured and communicated. This information is crucial as we continue to refine our Capability Architecture, ensuring that our descriptions accurately reflect the required skills and behaviours across all levels of our organisation.
Exploring Text Complexity through TTR and Lexical Diversity
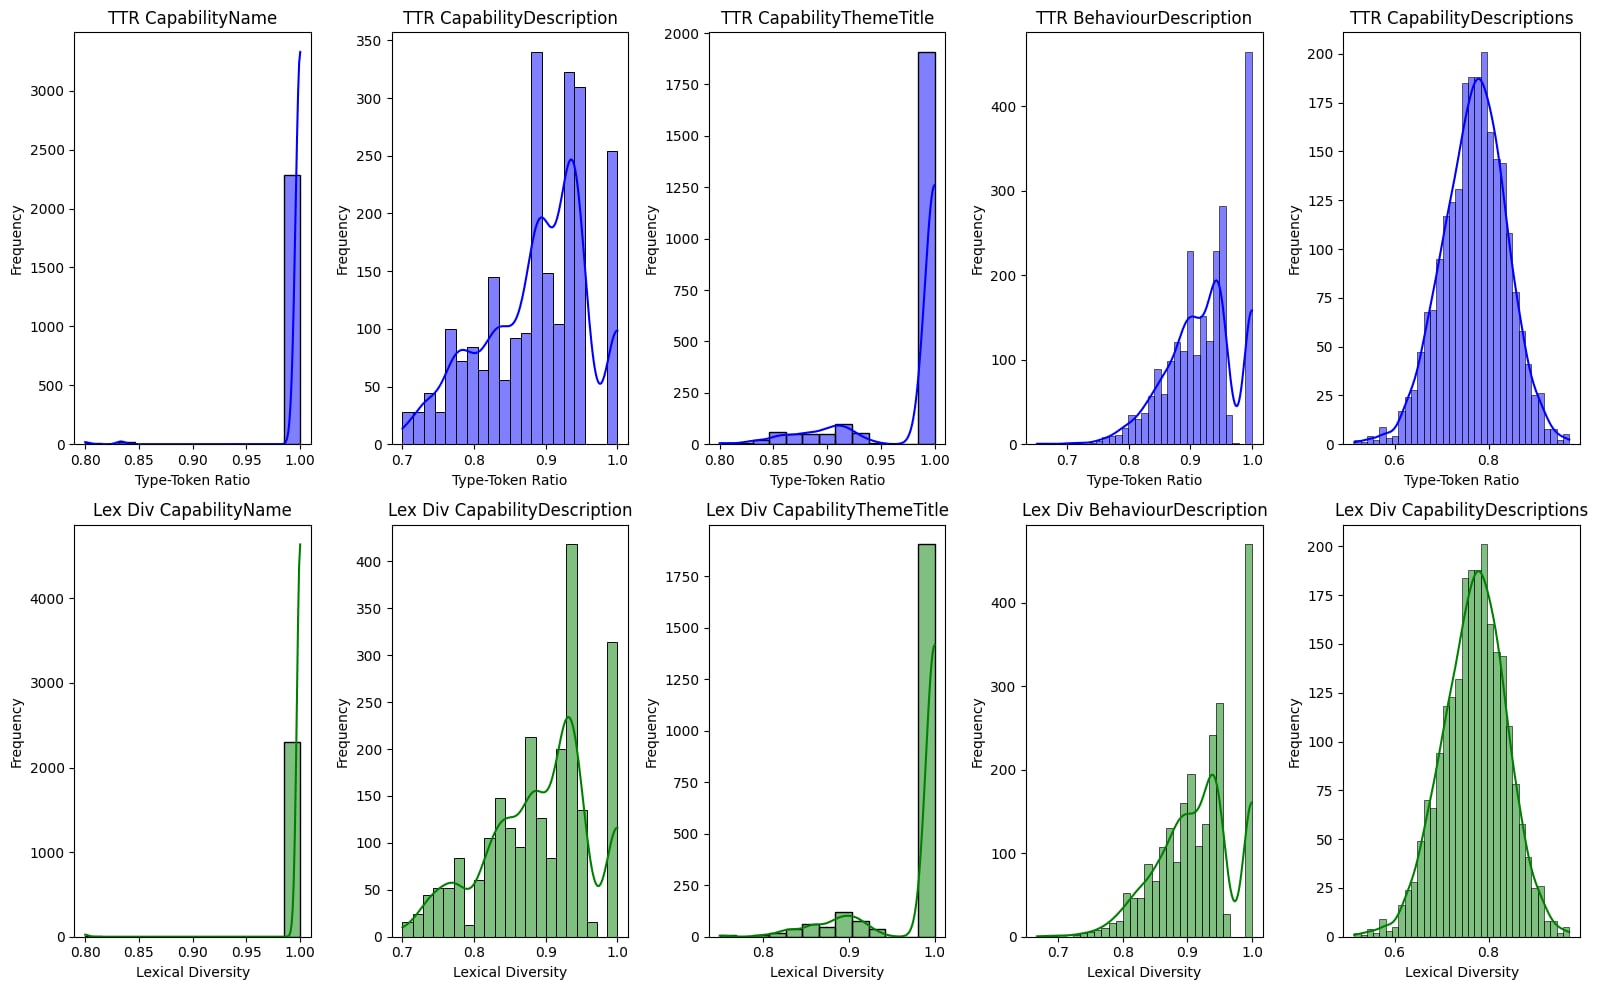
In addition to applying the TF-IDF heuristic, we conducted a detailed study of the Type-Token Ratio (TTR) and Lexical Diversity across the different components of our Capability Architecture. These metrics offer further insights into the complexity and variety of the language used in our capability descriptions.
The Type-Token Ratio (TTR) is a measure of the lexical diversity within a text. A high TTR indicates a greater variety of words relative to the total number of words, suggesting a more complex or nuanced text. Lexical Diversity, on the other hand, captures the richness of the vocabulary used in the text. Together, these metrics help us understand not just the complexity, but also the variety and richness of the language used to describe capabilities across our organisation.
Analysis of TTR and Lexical Diversity
Below are the distributions for TTR and Lexical Diversity for various components of the Capability Architecture:
- Capability Name: The TTR for Capability Names is uniformly high, indicating that each name is distinct and avoids repetition. This is expected, as capability names are designed to be concise and unique identifiers.
- Capability Description: The TTR and Lexical Diversity for Capability Descriptions show a broader spread. While many descriptions maintain high diversity, some are less varied, potentially indicating more straightforward language or repeated terms to reinforce key ideas.
- Capability Theme Title: Like Capability Names, the Theme Titles exhibit high TTR and Lexical Diversity. This suggests that these titles are also distinct and varied, as they are meant to capture broad thematic areas succinctly.
- Behaviour Description: The TTR and Lexical Diversity for Behaviour Descriptions display considerable variability, which aligns with their role in describing behaviours across different levels of seniority. The diversity in language reflects the need to articulate behaviours that range from simple, tactical actions for junior roles to complex, strategic behaviours for senior roles.
These findings are significant as they highlight areas where our capability descriptions might benefit from greater linguistic variety or where simplification could be necessary. The Behaviour Descriptions, in particular, demonstrate a wide range of complexity, underscoring the need for tailored language that appropriately reflects the requirements at different levels of the organisation.
Visualising the TTR and Lexical Diversity
The following visualisations present the TTR and Lexical Diversity distributions for each component of the Capability Architecture. These charts allow us to visually explore the complexity and diversity of the language used in our capability framework, helping us identify patterns and areas for improvement.
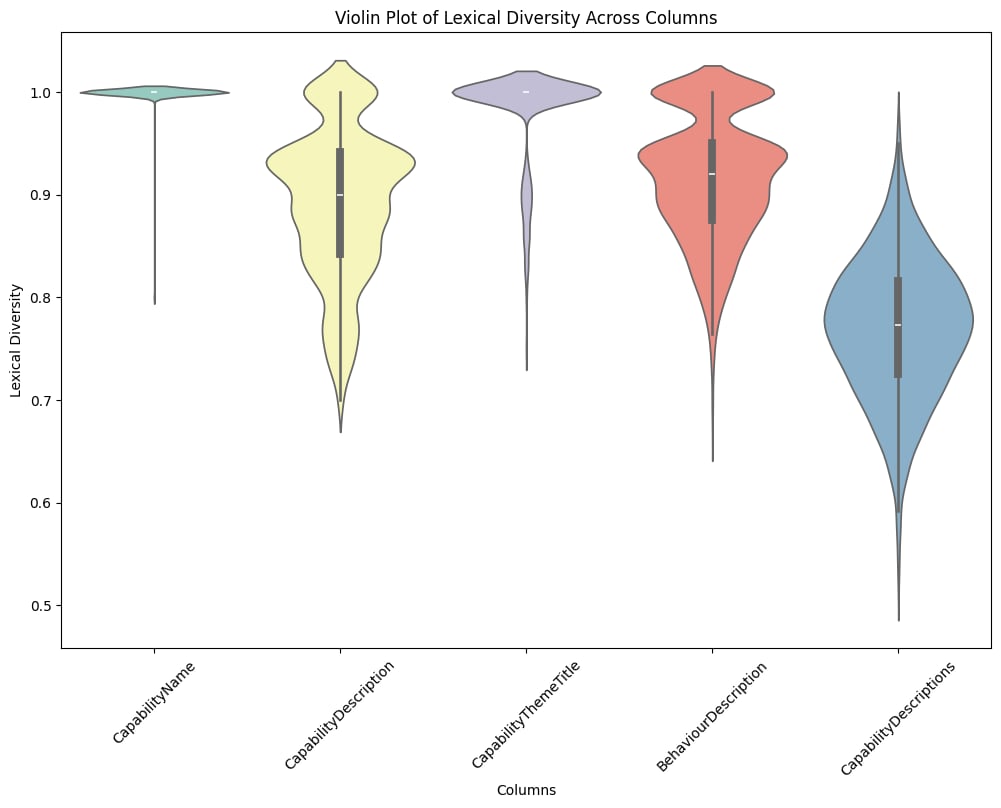
The violin plot of lexical diversity across various components of our Capability Architecture reveals interesting patterns in the language used. While Capability Names and Capability Theme Titles maintain consistently high lexical diversity, reflecting their distinct and unique nature, Capability Descriptions and Behaviour Descriptions exhibit more variability. This suggests that while the language used is generally rich and varied, there are instances of repetition, particularly in descriptions that aggregate multiple elements. This insight underscores the importance of ensuring that our capability descriptions remain both comprehensive and distinct, avoiding redundancy to better articulate the necessary skills and behaviours across all levels of our organisation.
These visualisations provide a nuanced view of the complexity and diversity within our Capability Architecture. They help us identify which areas of our framework might require additional attention, ensuring that our capability descriptions are both comprehensive and appropriately detailed.
So What? Who Cares? The Importance of Understanding Text Data Health
After conducting our detailed analysis of the Capability Architecture, one might ask: why does this matter? The answer lies in the fundamental principle of data science and analytics: "junk in, junk out." This phrase succinctly captures the reality that the quality of the output from any analysis is directly tied to the quality of the input data.
In our case, the input data is the text that forms the backbone of our Capability Architecture—names, descriptions, and behaviour expectations. Understanding the health of this text data is crucial because it directly influences the effectiveness of our capability frameworks, learning resources, and ultimately, the success of our employees in their roles.
When our text data is clear, diverse, and appropriately complex, it ensures that the capabilities we define are both comprehensive and understandable. This leads to more effective learning and development initiatives, better alignment between roles and expectations, and a more capable and agile workforce.
On the other hand, if our text data is inconsistent, overly simplistic, or too complex without reason, it can create confusion, misalignment, and gaps in our Capability Architecture. These issues might result in employees not receiving the guidance they need to develop the right skills or misunderstanding the expectations for their roles.
The Bottom Line: Quality Data Leads to Quality Outcomes
Our analysis has highlighted areas where our text data is strong, as well as areas that may need further refinement. By focusing on improving the health of our text data, we can ensure that our Capability Architecture is not just a document, but a powerful tool that drives real, measurable outcomes.
As we continue to refine our text data, we're not just enhancing our Capability Architecture—we're laying the groundwork for more effective learning and development, better role alignment, and ultimately, a more capable and engaged workforce.
In summary, understanding the health of our text data isn't just an academic exercise; it's a critical component of our strategy to empower our employees and drive organisational success. The old adage "junk in, junk out" reminds us that the effort we put into ensuring the quality of our input data will directly influence the quality of our outcomes. And that's something that everyone in our organisation should care about.